Global Market Commentary – A Stellar June
- FMeX

- Jul 7, 2025
- 10 min read
U.S. Markets Jump In June
June was another strong month for the stock market, thanks to a mix of solid company profits, easing inflation, and signs that the economy is still in decent shape. Most large companies in the S&P 500 beat expectations for their first-quarter earnings, and many shared slightly more optimistic forecasts for the months ahead. That gave investors confidence that businesses can keep making money even as overall growth slows a bit.
At the same time, the U.S. and China agreed to ease some tariffs from previous years and restart regular trade talks – a welcome sign for companies trying to manage supply-chain costs. And encouragingly, the latest inflation report showed prices rising more slowly, with the Consumer Price Index coming in near 2.4% year-over-year, the lowest in two years.
Other economic news was a mixed bag, but generally positive. The job market stayed strong, with 139,000 new jobs added in June and unemployment holding steady. Weekly jobless claims remained low, signaling few layoffs. Retail sales dipped slightly in May but are still higher than last year, while orders for big-ticket items like machinery and vehicles surged – suggesting businesses are still investing. Sentiment among consumers was split: the University of Michigan’s survey showed a big boost in optimism, while another gauge from the Conference Board dipped slightly. In housing, high mortgage rates (averaging 6.77%) continued to weigh on activity, with home construction and new-home sales staying soft, though not collapsing.
Still, not everything was smooth sailing. The economy shrank slightly in the first quarter, and the Federal
Reserve is holding interest rates steady for now, saying they want to see more progress on slowing inflation before considering cuts. Geopolitical tensions in the Middle East are also adding uncertainty. But for now, markets are powering ahead. All four major U.S. stock indexes rose between 4% and 6% in June, marking two straight months of solid gains and helping the S&P 500 break above the 6,000 mark for the first time ever and putting both the S&P 500 and NASDAQ in new record territory.
For the month of June:
The DJIA jumped 4.2%;
The S&P 500 gained 4.5%;
NASDAQ soared 5.9%; and
The Russell 2000 advanced 5.1%.
Global Markets Rally as Volatility Eases
Global markets rallied in June, taking cues from strong performance in the U.S. Developed international equities posted broad-based gains, with 48 of the 49 MSCI developed market indices advancing – an encouraging sign of widespread investor optimism and improving sentiment overseas.
Emerging markets joined the uptrend as well. Of the 46 MSCI emerging market indices, 43 ended the month in positive territory. This momentum was fueled by easing trade tensions, resilient earnings in key industries, and rising expectations that central banks in major economies may pivot to more accommodative policies if conditions warrant.
Market volatility subsided significantly, further contributing to the upbeat mood. Although there was a notable mid-month spike, the CBOE Volatility Index (VIX) – widely seen as a gauge of investor fear – fell more than 8% in June. This represented a sharp reversal from April’s volatility, when the VIX surged over 150% amid concerns over global tariffs and geopolitical uncertainty. The recent calming of those tensions, including signs of resolution in trade disputes, played a key role in restoring market confidence.
Commodities mirrored the equity rally. West Texas Intermediate crude rose $2.25 over the month to settle at $64.77 per barrel – a modest 3.5% monthly gain, though still down 22% from a year earlier.
Market Performance Around the World
Investors who looked beyond U.S. borders saw strong returns in June, as 48 of 49 MSCI-tracked developed markets posted gains – most exceeding 2%. Emerging markets also performed well, with 43 of 46 indices advancing, including 24 that rose more than 4%, highlighting the broad global participation in the month’s rally.
Index Returns | June 2025 |
MSCI EAFE | +2.09% |
MSCI EUROPE | +1.96% |
MSCI FAR EAST | +1.91% |
MSCI G7 INDEX | 4.40% |
MSCI NORTH AMERICA | +4.94% |
MSCI PACIFIC | +2.21% |
MSCI PACIFIC EX-JAPAN | +3.46% |
MSCI WORLD | +4.22% |
MSCI WORLD ex USA | +2.22% |
Source: MSCI. Past performance cannot guarantee future results
Sector Performance Was Strong
Sector performance in June was robust, with 10 of the 11 S&P 500 sectors posting gains. Notably, six sectors advanced by more than 4%, building on the momentum from May – a month that saw nine sectors rise, including four that surged more than 9%.
This marks a continued recovery from April, when only five sectors ended in positive territory, and from March, when nine sectors posted losses, including three that declined by over 7%.
While June’s absolute performance was impressive, relative gains were more subdued, with only two sectors outperforming month-to-month. However, that comparison may be somewhat misleading. Take Information Technology as an example: although it declined slightly on a relative basis in June, its +11.23% gain came on the heels of an extraordinary +12.24% surge in May – still an exceptional performance by any measure.
The wide dispersion of returns underscores the uneven nature of the current market landscape. Consumer Staples, for instance, experienced a modest decline in June following a modest gain in May – both a stark contrast to the double-digit gains posted by sectors like Information Technology during those same months. This divergence illustrates the complex interplay of macroeconomic factors and policy shifts impacting each sector differently.
Below are the sector returns for June and May, which highlight the short-term variability and underscore the importance of a nuanced view when assessing market leadership and laggards:
S&P 500 Sector | May 2025 | June 2025 |
Information Technology | +12.24% | +11.23% |
Energy | -2.01% | +4.98% |
Health Care | -4.66% | +3.08% |
Real Estate | +2.04% | +1.57% |
Consumer Staples | +1.99% | -0.91% |
Consumer Discretionary | +9.44% | +4.76% |
Industrials | +10.08% | +4.44% |
Financials | +5.31% | +4.01% |
Materials | +4.16% | +2.81% |
Communication Services | +9.34% | +9.07% |
Utilities | +2.48% | +0.78% |
Source: FMR
Fed Stays Put
The Federal Reserve, as anticipated, kept its benchmark interest rate unchanged at a target range of 5.25%–5.50%. In his post-meeting remarks, Fed Chair Jerome Powell emphasized the need for more conclusive signs that inflation is on a sustainable downward path before the central bank considers cutting rates.
“We’re prepared to maintain the current level of restriction for as long as appropriate,” Powell stated, adding that the Fed would need “greater confidence that inflation is moving sustainably toward 2 percent” before easing policy.

Inflation Drops
In June 2024, U.S. consumer prices experienced a modest decline, with the Consumer Price Index for All Urban Consumers (CPI-U) decreasing by 0.1% on a seasonally adjusted basis. This marked the first monthly drop since May 2020. Over the 12 months ending in June, the all-items index rose by 3.0% before seasonal adjustment, down from a 3.3% increase in May.
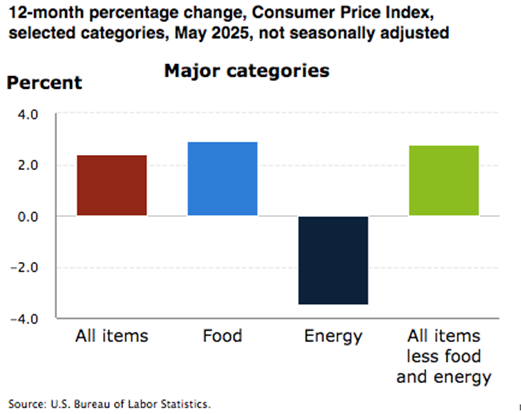
The decrease in the CPI was primarily driven by a significant 3.8% drop in gasoline prices, which followed a 3.6% decline in May. Shelter costs, a major component of the CPI, rose by 0.2% in June, a slowdown from the 0.4% increase observed in May. Food prices increased by 0.2% in June, with grocery store prices edging up by 0.1%. Notably, the core CPI, which excludes food and energy, rose by just 0.1% in June, the smallest increase since August 2021.
These figures suggest a broad moderation in inflation, aligning with reports from retailers about consumers pushing back against higher prices. The annual increase in consumer prices has slowed from a peak of 9.1% in June 2022. This trend supports expectations that the Federal Reserve may consider cutting interest rates in the near future, especially as inflation pressures ease and the labor market shows signs of softening.
However, some areas remain inflation hotspots. For instance, motor vehicle insurance prices rebounded by 0.9% in June after falling 0.1% in May.
Additionally, costs for household furnishings, personal care, education, recreation, and apparel saw increases. Despite these pockets of rising prices, the overall trend indicates a cooling of inflation, providing some relief to consumers and policymakers alike.
GDP in 1Q2025 Down 0.5%
According to the U.S. Bureau of Economic Analysis, the U.S. economy contracted at an annual rate of 0.5% in the first quarter of 2025, marking the first quarterly decline since early 2022. This third estimate represents a downward revision from the previous estimate of a 0.2% decline.

The contraction was primarily driven by a significant increase in imports, which surged by 41.3%, subtracting 4.83 percentage points from GDP. This surge in imports was largely due to businesses accelerating purchases ahead of anticipated tariffs. Additionally, federal government spending decreased by 4.6%, the largest drop since 2022, further contributing to the GDP decline.
Consumer Sentiment Leaps
In June 2025, the University of Michigan's Surveys of Consumers reported a notable improvement in consumer sentiment, marking the first increase in six months. The Index of Consumer Sentiment rose by 16.3% from May to reach 60.7.
Despite this uptick, the index remains approximately 18% below the post-election high observed in December 2024. This positive shift was broad-based, with significant gains in expectations for personal finances and business conditions, both increasing by around 20% or more.

Inflation expectations also showed a downward trend. Year-ahead inflation expectations decreased from 6.6% in May to 5.0% in June, while long-run expectations fell from 4.2% to 4.0%. These are the lowest readings in several months, suggesting a softening in consumers' inflation concerns. However, inflation expectations remain above the levels seen in the second half of 2024, indicating that consumers still perceive persistent inflation risks.
Despite the overall improvement in sentiment, consumers continue to express concerns about potential economic slowdowns and the impact of tariffs. While worries about the Middle East have not significantly influenced economic outlooks, the uncertainty surrounding trade policies continues to weigh on consumer confidence. These mixed sentiments reflect an economy in transition, with consumers cautiously optimistic but still wary of underlying risks.
Strong Corporate Earnings Continue
Research firm FactSet released the following key metrics for companies within the S&P 500 as of June 27th:
Earnings Growth: For Q2 2025, the estimated (year-over-year) earnings growth rate for the S&P 500 is 5.0%. If 5.0% is the actual growth rate for the quarter, it will mark the lowest earnings growth reported by the index since Q4 2023 (4.0%).
Earnings Revisions: On March 31, the estimated (year-over-year) earnings growth rate for the S&P 500 for Q2 2025 was 9.4%. All 11 sectors are expected to report lower earnings today (compared to March 31) due to downward revisions to EPS estimates.
Earnings Guidance: For Q2 2025, 59 S&P 500 companies have issued negative EPS guidance and 51 S&P 500 companies have issued positive EPS guidance.
Valuation: The forward 12-month P/E ratio for the S&P 500 is 21.9. This P/E ratio is above the 5-year average (19.9) and above the 10-year average (18.4).
Deceleration in Home Price Growth
The S&P CoreLogic Case-Shiller Index for April 2025 reveals a continued deceleration in U.S. home price growth, with the National Home Price NSA Index recording a 2.7% annual gain – down from 3.4% in March. This marks the slowest year-over-year appreciation since mid-2023. The 10-City and 20-City Composites also saw reduced annual increases of 4.1% and 3.4%, respectively.
Notably, New York led with a 7.9% annual gain, followed by Chicago (6.0%) and Detroit (5.5%), while Tampa and Dallas experienced annual declines of 2.2% and 0.2%, respectively.
The chart that follows compares year-over-year returns for different housing price ranges (tiers) in New York.

“The housing market continued its gradual deceleration in April, with annual price gains slowing to their most modest pace in nearly two years. What's particularly striking is how this cycle has reshuffled regional leadership – markets that were pandemic darlings are now lagging, while historically steady performers in the Midwest and Northeast are setting the pace. This rotation signals a maturing market that's increasingly driven by fundamentals rather than speculative fervor.”
Retail Sales Drop in May
The May 2025 report showed a 0.9% decline in retail and food services sales from the previous month, totaling $715.4 billion – the largest drop since May 2023. The decline was driven largely by a 3.5% dip in motor vehicle sales, following a surge earlier this year as consumers rushed to beat expected tariffs on imports.

Other categories – like home improvement, electronics, and grocery stores – also posted declines. Still, some segments showed strength: nonstore retailers (e.g., e-commerce) reported an 8.3% year-over-year gain, while food services and drinking places rose 5.3% compared to May 2024.
Despite the overall decline, the "control group" – which excludes autos, gas, building materials, and food services – rose 0.4% in May. This suggests stable core consumer spending, in line with forecasts, and supports expectations for 2% annualized GDP growth in Q2. Analysts believe the May dip may be temporary, influenced by early-year spending ahead of tariffs and unseasonably wet weather.
Leading Economic Index Down 0.1%
The Leading Economic Index for the U.S. ticked down 0.1% in May 2025, to 99.0 (2016 = 100), following a revised 1.4% decline in April, down from the previously reported 1.0% drop.

This marks 15 consecutive months of decline. Over the six-month period ending in May, the LEI decreased by approximately 2.0%, mirroring the decline seen in the previous six months.
Author: FMeX
Published: 7/7/2025
Sources: umich.edu; spglobal.com; census.gov; bea.gov; factset.com; conference-board.org; msci.com; fidelity.com; nasdaq.com; wsj.com; morningstar.com
Important Disclosures: Information presented is believed to be factual and up to date. It should not be regarded as a complete analysis of the subjects discussed. Different types of investments involve varying degrees of risk. All investment strategies have the potential for profit or loss. Past performance is not a reliable indicator of current and future results. The information presented herein is intended for educational purposes only and is in no way intended to be interpreted as investment advice or as a device with which to ascertain investment decisions or an investment approach. The specifics of the activity presented by the EWM Asset Management team is intended for general information only. The actual impact to your personal portfolio is not represented by the statements made in this document and you should proactively review your monthly/quarterly statements or contact the office to speak to an Advisor to validate your specific transactions. The S&P 500 is an unmanaged index used as a general measure of market performance. You cannot invest directly in an index. Accordingly, performance results for investment indexes do not reflect the deduction of transaction and/or custodial charges or the deduction of an investment-management fee, the incurrence of which would have the effect of decreasing historical performance results. Any charts, graphs, or visual aids presented herein are intended to demonstrate concepts which cannot be fully explained without the assistance of a professional from EWM. Readers should not in any way interpret these visual aids as a device with which to ascertain investment decisions or an investment approach. Only your professional adviser should interpret this information.