Global Market Commentary – A Warm July
- FMeX

- Aug 4, 2025
- 11 min read

U.S. Markets Continue To Rise in July
July continued the stock market’s strong summer run, buoyed by robust second-quarter earnings, moderating inflation, and signs of steady – if uneven – economic growth. A majority of S&P 500 companies reported better-than-expected profits, with many also lifting their guidance for the rest of the year. This fueled investor optimism that corporate America remains resilient even as broader economic momentum shows signs of cooling. Meanwhile, the inflation picture improved further: the Consumer Price Index rose just 2.3% year-over-year, marking the lowest pace since early 2022 and increasing confidence that the Federal Reserve may be nearing a turning point on interest rates.
Adding to the positive backdrop, trade relations between the U.S. and China appeared to thaw further, with both sides agreeing in July to resume high-level trade negotiations and remove some remaining tariffs on industrial components. These developments helped alleviate ongoing concerns about supply chain costs and geopolitical uncertainty. On the domestic front, the labor market remained solid: employers added 146,000 jobs in July, and the unemployment rate held at 3.7%. While weekly jobless claims inched higher, they stayed within historically low ranges. Retail sales ticked up slightly in June, and new orders for durable goods remained elevated, suggesting firms are still investing. However, mortgage rates – now averaging 6.89% – continue to weigh on home construction and sales, which remain subdued but stable.
While not all indicators were upbeat – the economy contracted again in Q1 and consumer sentiment remains mixed – markets pushed higher. The Fed held interest rates steady again in July, but officials signaled that rate cuts could come as soon as Q4 if inflation continues to decline. Rising tensions in the Middle East remain a concern, but equity investors largely brushed them off.
For the month of July, all four major U.S. indexes posted gains for the third straight month, with:
· The S&P 500 closing at a new all-time high above 6,300;
· The Dow Jones Industrial Average rose 0.1%;
· The S&P 500 gained 2.4%;
· NASDAQ climbed 4.2%; and
· The Russell 2000 advanced 1.7%.
Global Markets Rally as Volatility is Flat
Global markets underperformed relative to the U.S. in July, with noticeable divergence between developed and emerging economies. Developed international equities saw a broad-based pullback – 29 of the 49 MSCI developed market indices declined – marking a reversal of the more optimistic trend that had prevailed for much of 2025.
Emerging markets, by contrast, delivered strong results. An impressive 39 of 46 MSCI emerging market indices ended the month in positive territory.
This outperformance was supported by a favorable macro backdrop: easing trade tensions, resilient corporate earnings in key sectors, and growing expectations that major central banks will continue shifting toward more accommodative policy stances as conditions evolve.
Market volatility was largely unchanged, contributing to a constructive risk environment. Despite a few brief mid-month spikes triggered by geopolitical headlines, the CBOE Volatility Index remained remarkably stable. This continues the cooling trend seen since April, when the VIX had more than doubled amid escalating tariff threats and global uncertainty. Improved central bank communication, solid earnings, and receding geopolitical tensions helped suppress volatility and support investor sentiment.
Commodities also benefited from the risk-on mood. West Texas Intermediate crude rose $6.48 to $69.33 per barrel in July – a 6.5% gain – though prices remain about 12% below year-ago levels. The rebound in oil was driven by a mix of robust summer travel demand, OPEC+ production restraint, and reduced recession fears. Gold prices saw modest gains as well, buoyed by a weaker dollar and expectations of future Fed rate cuts.
Average annual Brent crude oil price from 1976 to 2025

Market Performance Around the World
Investors venturing beyond U.S. borders encountered weaker returns in July. Developed markets underperformed, with 29 of 49 MSCI-tracked indices declining – many by more than 2%.
In contrast, emerging markets posted solid results: 39 of 46 indices advanced, and 20 of those recorded gains exceeding 2%. This stark divergence underscores the uneven pace of global economic and market recovery.
Index Returns | July 2025 |
MSCI EAFE | -1.45% |
MSCI EUROPE | -1.67% |
MSCI FAR EAST | -0.70% |
MSCI G7 INDEX | +1.63% |
MSCI NORTH AMERICA | +2.12% |
MSCI PACIFIC | -0.54% |
MSCI PACIFIC EX-JAPAN | +1.20% |
MSCI WORLD | +1.23% |
MSCI WORLD ex USA | -1.27% |
Source: MSCI. Past performance cannot guarantee future results
Sector Performance Was Strong
Sector performance in July remained resilient, with 9 of 11 S&P 500 sectors posting gains. This followed a similarly strong June, when 10 of 11 sectors advanced. The breadth of participation remained healthy: six sectors rose by more than 2% in July, extending momentum from June (when six gained over 4%) and May (when nine sectors climbed, including four that surged over 9%).
This upward trajectory marks a continued recovery from April’s narrow breadth – only five sectors ended that month in positive territory – and from March, when losses were widespread, including three sectors that declined more than 7%.
While July’s results were constructive, the pace of gains moderated. Only one sector (Utilities) outperformed its June result, underscoring that relative performance cooled. Still, that’s less a red flag than a natural breather following two strong months of broad-based strength.
The dispersion of returns highlights an increasingly uneven market. Consumer Staples posted a second consecutive monthly decline, in sharp contrast to Information Technology, which delivered a double-digit gain in June and followed up with a solid 6.5% in July. This divergence reflects the varying impact of macroeconomic shifts – like interest rate expectations and inflation data – on sector-specific fundamentals.
Below is a breakdown of sector returns for June and July, illustrating both the short-term volatility and the importance of a differentiated view when evaluating market leadership:
S&P 500 Sector | June 2025 | July 2025 |
Information Technology | +11.23% | +6.51 |
Energy | +4.98% | +2.75% |
Health Care | +3.08% | -0.04% |
Real Estate | +1.57% | +2.26% |
Consumer Staples | -0.91% | -1.49% |
Consumer Discretionary | +4.76% | +2.12% |
Industrials | +4.44% | +3.47% |
Financials | +4.01% | +1.33% |
Materials | +2.81% | +0.59% |
Communication Services | +9.07% | +0.56% |
Utilities | +0.78% | +4.68% |
Source: FMR
Fed Stays Put, But is Divided
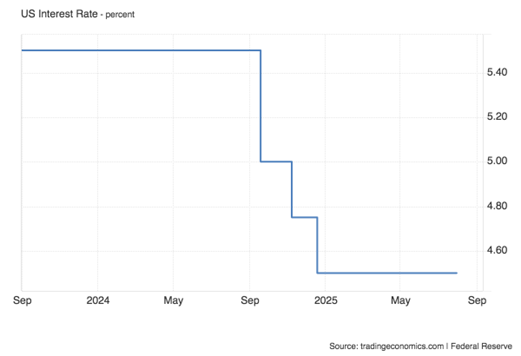
On July 30–31, 2025, the Federal Open Market Committee voted 9‑2 to maintain the federal funds target rate at 4.25%–4.50%, marking the fifth straight meeting with no change in policy. The decision came amid a backdrop of moderate inflation still above the Fed’s 2% goal, steady – but not accelerating – economic growth, and trade-related uncertainties, especially from high tariffs. Despite external political pressure, notably from former President Trump, Chair Jerome Powell emphasized the Fed’s commitment to data‑driven policymaking and warned that premature cuts could compromise inflation containment efforts.
Notably, two Fed governors – Michelle Bowman and Chris Waller – dissented, arguing for an immediate 25‑basis‑point cut, the first such dual dissent since 1993. Their stance highlights growing internal debate over whether the central bank should pivot more quickly toward easing amid signs of slowing demand and potential downside risks to employment and growth.
For context, the last time the Fed lowered rates was on September 18, 2024, when it executed a 50‑basis‑point cut, the first in four years, bringing the benchmark down to 4.25%–4.50%. This followed earlier cuts in late 2024 and was aimed at cushioning against slowing activity while inflation remained elevated. Since then, the rate has stayed unchanged for the first half of 2025, and while the Fed continues to foresee two potential rate cuts before year‑end, markets are increasingly tempering expectations for a move as soon as the September meeting.
United States Fed Funds Interest Rate
June Inflation Up 0.3%, Driven by Energy
The June 2025 CPI report showed that inflation could be gaining traction. On a seasonally adjusted basis, the all-items CPI rose 0.3%, following a smaller 0.1% increase in May. On a year-over-year basis, inflation reached 2.7%, up from 2.4% the month prior. Energy was a major driver of this uptick, with a 0.9% monthly increase – particularly in gasoline and electricity prices. Food prices also rose steadily by 0.3%. Meanwhile, core CPI, which excludes food and energy, rose 0.2% for the month and now stands 2.9% higher than a year ago. This reflects persistent price pressure in key categories such as shelter, medical care, and household furnishings.
This reacceleration in both headline and core inflation raises questions about whether earlier disinflation trends have stalled. Both measures exceed the Fed’s 2% target, suggesting inflation may be stickier than policymakers expected.
Shelter and services costs – typically slower to adjust – are proving especially stubborn, reinforcing the notion that inflation is not just a short-term fluctuation but an embedded feature of the current economic landscape.

GDP in 2Q2025 Up 3.0%
In the second quarter of 2025, U.S. real Gross Domestic Product (GDP) increased at an annualized rate of 3.0%, according to the advance estimate released by the Bureau of Economic Analysis (BEA). This marks a sharp rebound from the first quarter of 2025, when real GDP declined by 0.5%. For context, the fourth quarter of 2024 had posted a 2.4% gain, suggesting a return to moderate growth following the Q1 contraction.

Several factors contributed to the Q2 expansion. The most significant was a sharp decline in imports, which are subtracted from GDP calculations and thus boosted the overall figure. Consumer spending also increased during the quarter, alongside more modest gains from private inventories and exports. The reversal in import activity, particularly after a surge in Q1, played an outsized role in the quarter’s headline growth.
Other key metrics showed more tempered economic activity. Real final sales to private domestic purchasers – which excludes inventories, government spending, and net exports – rose by just 1.2%, signaling weaker underlying demand. On average, GDP growth for the first half of 2025 remains below the 2.5% pace seen in 2024.
Consumer Confidence Up in July
The Conference Board Consumer Confidence Index improved by 2.0 points in July to 97.2 (1985=100), from 95.2 in June (revised up by 2.2 points). The Present Situation Index – based on consumers’ assessment of current business and labor market conditions – fell 1.5 points to 131.5. The Expectations Index – based on consumers’ short-term outlook for income, business, and labor market conditions – rose 4.5 points to 74.4. But expectations remained below the threshold of 80 that typically signals a recession ahead for the sixth consecutive month.
“Consumer confidence has stabilized since May, rebounding from April’s plunge, but remains below last year’s heady levels. In July, pessimism about the future receded somewhat, leading to a slight improvement in overall confidence. All three components of the Expectation Index improved, with consumers feeling less pessimistic about future business conditions and employment, and more optimistic about future income. Meanwhile, consumers’ assessment of the present situation was little changed. They were a tad more positive about current business conditions in July than in June. However, their appraisal of current job availability weakened for the seventh consecutive month, reaching its lowest level since March 2021. Notably, 18.9% of consumers indicated that jobs were hard to get in July, up from 14.5% in January.”

Strong Corporate Earnings Continue
Research firm FactSet released the following key metrics for companies within the S&P 500 as of July25th:
Earnings Scorecard: For Q2 2025 (with 34% of S&P 500 companies reporting actual results), 80% of S&P 500 companies have reported a positive EPS surprise and 80% of S&P 500 companies have reported a positive revenue surprise.
Earnings Growth: For Q2 2025, the blended (year-over-year) earnings growth rate for the S&P 500 is 6.4%. If 6.4% is the actual growth rate for the quarter, it will mark the lowest earnings growth rate reported by the index since Q1 2024 (5.8%).
Earnings Revisions: On June 30, the estimated (year-over-year) earnings growth rate for the S&P 500 for Q2 2025 was 4.9%. Seven sectors are reporting higher earnings today (compared to June 30) due to positive EPS surprises and upward revisions to EPS estimates.
Earnings Guidance: For Q3 2025, 13 S&P 500 companies have issued negative EPS guidance and 12 S&P 500 companies have issued positive EPS guidance.
Valuation: The forward 12-month P/E ratio for the S&P 500 is 22.4. This P/E ratio is above the 5-year average (19.9) and above the 10-year average (18.4).
Deceleration in Home Price Growth
In June 2025, U.S. existing-home sales dropped 2.7%, falling to a seasonally adjusted annual rate of 3.93 million units, the lowest monthly pace since September 2024. Sales declined in the Northeast, Midwest, and South, while the West saw a modest increase. Year-over-year, sales held flat, underscoring ongoing buyer challenges amid persistently high mortgage rates near 6.8–7%.
Meanwhile, the median existing-home price surged to $435,300, up 2% from last year and marking an all‑time high for the month of June. Despite rising inventory – now at 1.53 million units, a 15.9% year-over-year increase, with roughly 4.7 months’ supply – prices remain elevated, fueled by long-term undersupply and strong demand from non-first-time buyers.

Retail Sales Rebound in June
In June 2025, seasonally adjusted retail and food service sales reached $720.1 billion, representing a 0.6% increase from May and a 3.9% gain year-over-year, even as May trends were downwardly revised. The second‑quarter total (April–June 2025) showed a 4.1% increase over the same period in 2024.

Breaking down the components, retail trade (excluding food service) increased 0.6% from May and 3.5% versus June 2024. Nonstore (e‑commerce) retail sales surged 4.5% over the prior year, while food service and drinking‑place sales climbed 6.6% year-over-year. These monthly figures reinforce the strength in both physical and online consumer spending.
Although not part of the monthly release, the Census Bureau’s quarterly e‑commerce estimate for 1Q 2025 reported $300.2 billion in e‑commerce sales, flat from 4Q 2024 but up 6.1% year-over-year, accounting for about 16.2% of total retail sales in Q1. This supports the broader trend of sustained online growth even as overall retail faces inflationary headwinds.
Leading Economic Index Declined in June
According to the Conference Board, the LEI fell 0.3% in June 2025, landing at 98.8 (with 2016 set as the base year = 100). This is the second straight month of decline and brings the six-month change to −2.8%, compared to a smaller −1.3% drop in the second half of 2024. This worsening pace might suggest that forward-looking economic momentum is eroding faster than before.
Several components dragged the index lower in June. Consumer expectations fell, showing that households are growing more concerned about their future finances.
Manufacturing new orders – a sign of future production – continued to shrink, and initial jobless claims edged higher, hinting at early cracks in the labor market. The average workweek in manufacturing also declined, which tends to occur when companies anticipate less demand. Building permits, another key input, were flat – indicating that construction activity may stall going into the second half of the year.
The only major positive was from stock prices, which rose during the month and added upward pressure on the index. But this strength is likely driven by investor optimism and expectations of Fed easing, rather than hard economic data. The Conference Board emphasized that the six-month diffusion index – which tracks how many of the ten components are rising – remained below 50% for the third straight month, a historical red flag that has often preceded recessions.
Still, the organization is not calling for a recession. It expects real GDP growth to slow to 1.6% in 2025, down from 2.8% in 2024, as consumer spending, business investment, and hiring all cool. In their words, “while the U.S. economy remains resilient, rising headwinds suggest growth will decelerate through the end of the year and into early 2026.”

Author: FMeX
Published: 8/4/2025
Sources: : bls.gov; bea.gov; factset.com; conference-board.org; msci.com; fidelity.com; nasdaq.com; wsj.com; morningstar.com; conference-board.org; nar.realtor
Important Disclosures: Information presented is believed to be factual and up to date. It should not be regarded as a complete analysis of the subjects discussed. Different types of investments involve varying degrees of risk. All investment strategies have the potential for profit or loss. Past performance is not a reliable indicator of current and future results. The information presented herein is intended for educational purposes only and is in no way intended to be interpreted as investment advice or as a device with which to ascertain investment decisions or an investment approach. The specifics of the activity presented by the EWM Asset Management team is intended for general information only. The actual impact to your personal portfolio is not represented by the statements made in this document and you should proactively review your monthly/quarterly statements or contact the office to speak to an Advisor to validate your specific transactions. The S&P 500 is an unmanaged index used as a general measure of market performance. You cannot invest directly in an index. Accordingly, performance results for investment indexes do not reflect the deduction of transaction and/or custodial charges or the deduction of an investment-management fee, the incurrence of which would have the effect of decreasing historical performance results. Any charts, graphs, or visual aids presented herein are intended to demonstrate concepts which cannot be fully explained without the assistance of a professional from EWM. Readers should not in any way interpret these visual aids as a device with which to ascertain investment decisions or an investment approach. Only your professional adviser should interpret this information.